
A workplace may complete an entire month without a reported injury while serious hazards remain unresolved. Machine guards may be damaged, emergency exits may be obstructed, and critical maintenance may be overdue. An incident-free report alone cannot show whether these risks are being controlled.
This is where Key Performance Indicators (KPIs) become valuable. Well-designed KPIs help organizations evaluate safety performance, identify weaknesses and direct attention toward the actions that matter most.
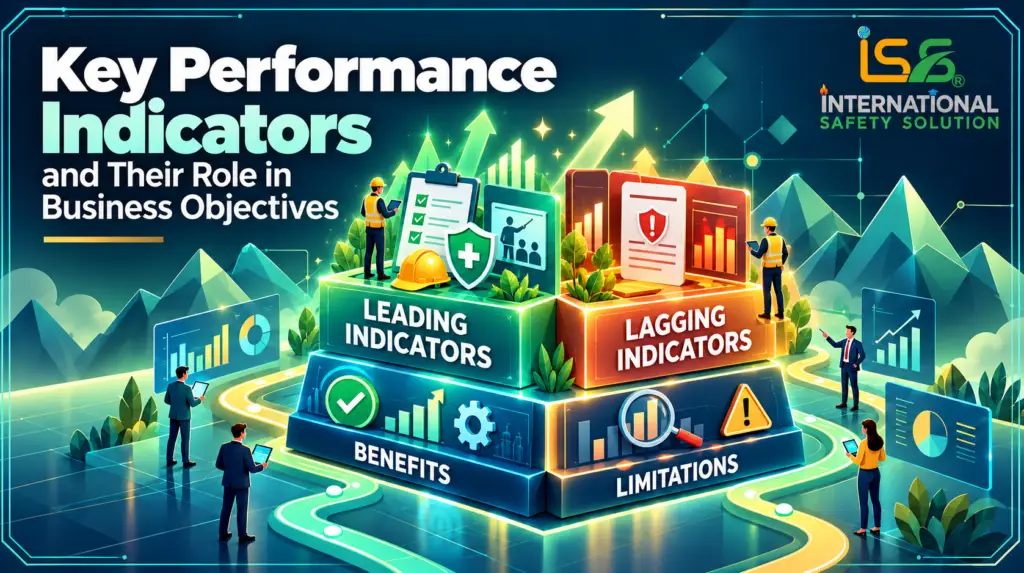
To build a meaningful picture, organizations need both leading indicators, which examine preventive efforts and control performance, and lagging indicators, which measure outcomes that have already occurred. OSHA supports using both approaches to evaluate workplace safety and health performance.
What Are Key Performance Indicators?
Key Performance Indicators are selected measures used to assess progress toward important organizational objectives.
In occupational health and safety, these objectives may include preventing injuries, controlling hazardous exposures, maintaining reliable protective systems and improving emergency preparedness.
A useful safety KPI connects a measurable result to a specific objective. For example:
- Objective: Improve the reliability of critical safety equipment.
- KPI: Percentage of scheduled critical equipment maintenance completed on time.
- Management response: Investigate overdue work and address the causes.
Every recorded number is a metric, but every metric does not need to become a KPI. The number of emails sent by a safety department may be easy to count, yet it provides little evidence that workplace risks are being controlled.
The value of a KPI depends on the decisions it supports.
Leading Indicators: Measuring Preventive Performance
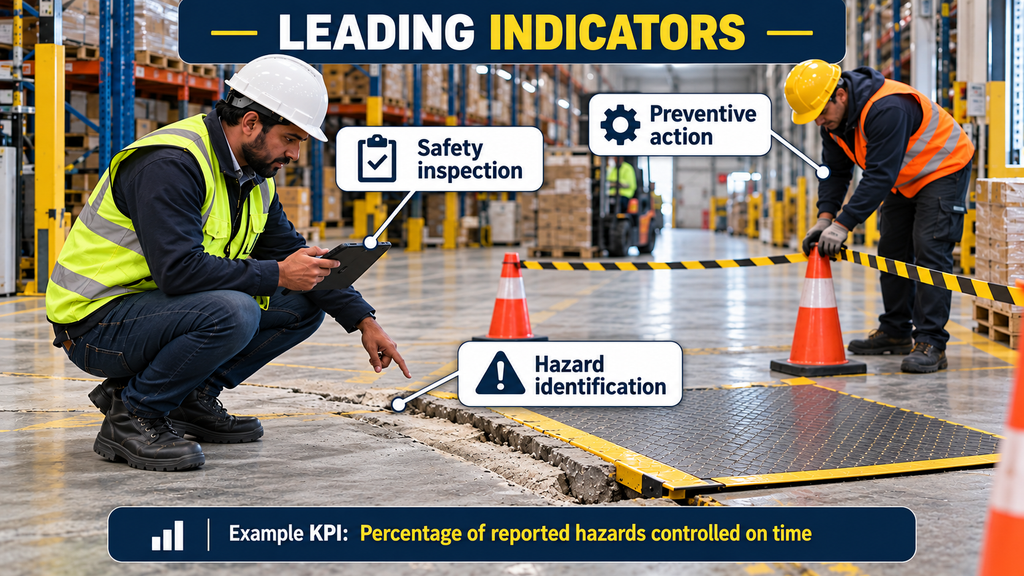
Leading indicators provide information about activities, conditions and controls that can influence future safety outcomes. They help organizations identify weaknesses and take action before harm occurs.
For example, tracking how quickly reported hazards are assessed and addressed can reveal whether the organization responds effectively to emerging risks. OSHA identifies response time to hazard reports as one possible leading indicator.
Leading indicators support prevention, but they do not guarantee that an incident will never happen.
Practical Types of Leading Indicators
The following categories provide a useful way to organize leading indicators. They are practical groupings rather than a universal classification system.
| Category | What it measures | Example KPI |
|---|---|---|
| Hazard identification and response | How effectively hazards are identified and addressed | Percentage of high-risk hazard reports assessed within the defined response time |
| Inspection and maintenance | Completion of preventive checks and maintenance | Percentage of critical preventive maintenance tasks completed by their due dates |
| Training and competency | Whether workers have the knowledge and practical ability required | Percentage of relevant workers who pass a practical competency assessment |
| Critical control verification | Whether important safeguards are present and functioning | Percentage of sampled isolation arrangements meeting verification requirements |
| Worker participation | Employee involvement in improving safety | Percentage of reported concerns receiving documented feedback within the agreed period |
| Corrective action effectiveness | Whether completed actions resolve the underlying problem | Percentage of sampled closed actions verified as effective |
Lagging Indicators: Measuring What Has Happened
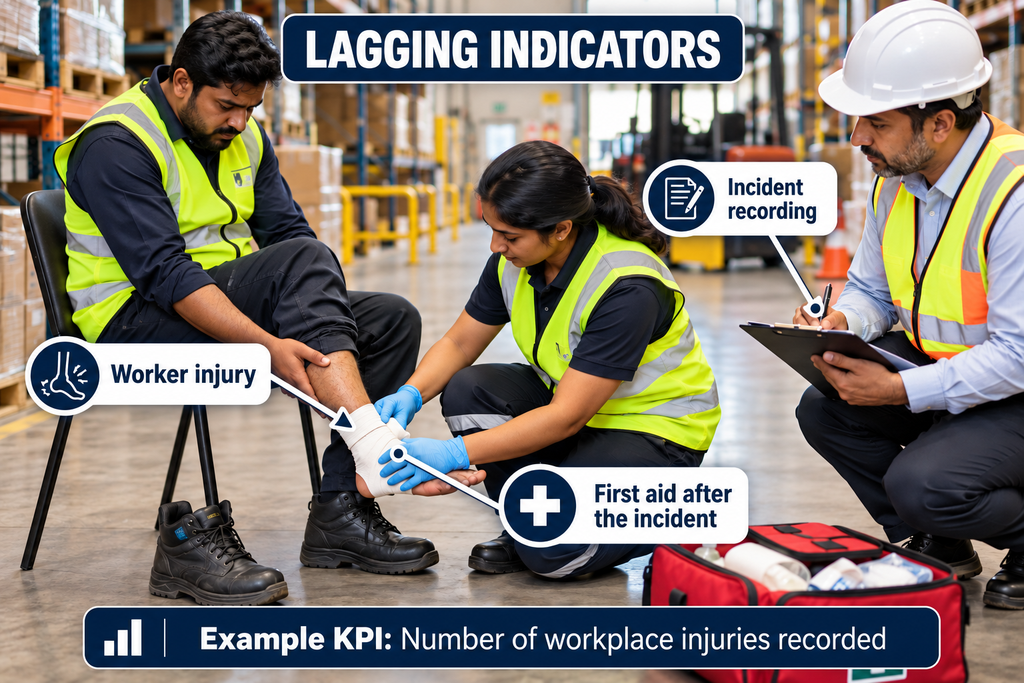
Lagging indicators measure outcomes or events that have already occurred. They help organizations understand past performance, identify recurring problems and assess the consequences of failures.
Examples include work-related injuries, occupational illnesses, equipment damage and fire incidents.
These indicators remain important because preventive activity alone cannot establish whether desired outcomes are being achieved.
Practical Types of Lagging Indicators
| Category | What it measures | Example KPI |
|---|---|---|
| Injury outcomes | Actual work-related injuries | Number or rate of defined injury cases |
| Occupational health outcomes | Identified work-related illness | Number of newly identified occupational illness cases |
| Severity outcomes | Consequences of injury or illness | Workdays lost due to work-related cases |
| Property and equipment damage | Physical losses from incidents | Number and cost of safety-related damage events |
| Fire and loss-of-containment events | Failures involving fire or unintended releases | Number of defined fire incidents or chemical releases |
| Operational consequences | Disruption caused by safety events | Hours of unplanned shutdown following safety incidents |
Leading vs. Lagging Indicators
| Aspect | Leading indicators | Lagging indicators |
|---|---|---|
| Main focus | Preventive efforts and control performance | Events and consequences |
| Main question | Are we managing the risks effectively? | What outcomes have occurred? |
| Example | Percentage of critical safeguards verified as effective | Number of incidents involving safeguard failure |
| Main benefit | Supports earlier intervention | Shows actual results and historical patterns |
| Main limitation | Can reward activity without proving effectiveness | Often provides feedback after harm or loss |
| Best use | Identifying and correcting weaknesses | Evaluating outcomes and learning from failures |
These measures are most useful when interpreted together. A maintenance completion rate may look strong, but recurring equipment failures could indicate poor maintenance quality, unsuitable intervals or an incomplete maintenance scope.
Are Near Misses Leading or Lagging Indicators?
Near misses require careful interpretation.
A near-miss event count records something that has already happened, so it is retrospective. However, the reporting and investigation process can also provide information that supports prevention.
For example:
- Near-miss events recorded: A retrospective event measure.
- Percentage investigated within the required timeframe: A measure of response performance.
- Percentage of resulting actions verified as effective: A measure of preventive follow-through.
An increase in reports does not automatically mean that safety has deteriorated. It may reflect improved reporting confidence, increased exposure, worsening conditions or a combination of factors. Investigation and context are essential.
Practical Example: Fire Safety Performance
Consider a warehouse containing combustible packaging, electrical equipment and regularly occupied work areas.
Its objective is to reduce fire risk and maintain effective emergency arrangements. The following illustrative indicators could support that objective:
| Safety objective | Leading indicator | Related lagging indicator |
|---|---|---|
| Maintain fire protection systems | Percentage of scheduled inspections and tests completed on time | Recorded failures during actual fire events |
| Keep escape routes usable | Percentage of sampled escape routes meeting inspection criteria | Evacuations affected by obstructed routes |
| Improve emergency preparedness | Percentage of drill actions completed and verified | Injuries or delays recorded during actual evacuations |
| Control identified defects | Number and age of overdue critical fire safety defects | Fire incidents associated with unresolved defects |
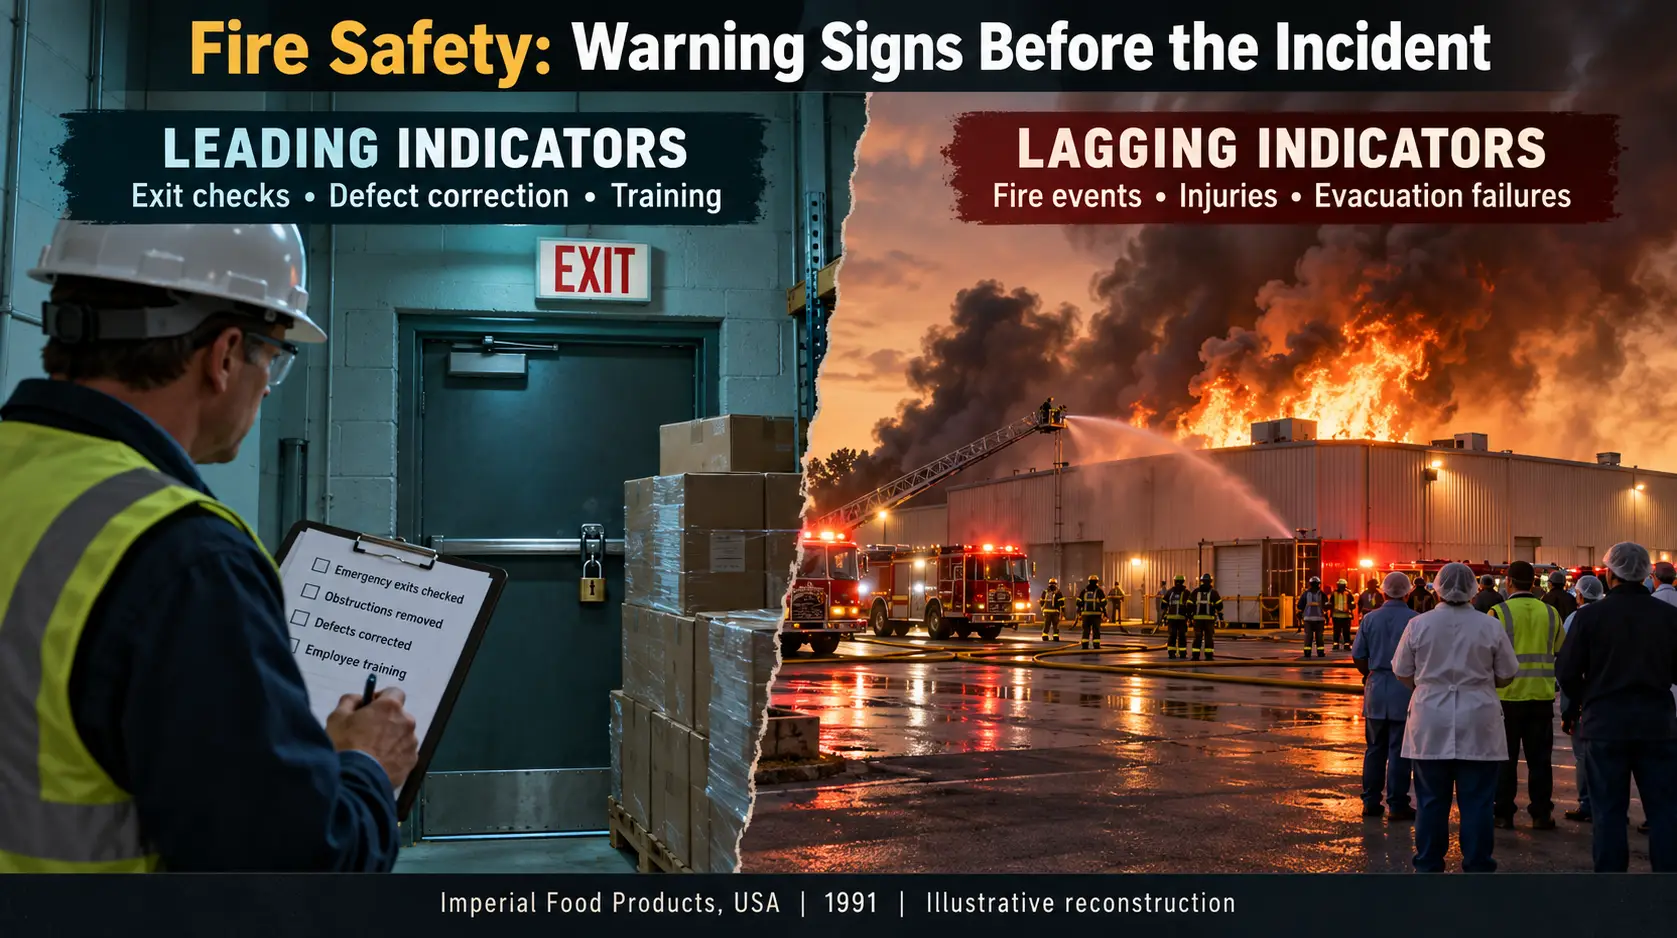
Suppose the warehouse records no fires for six months, but several critical defects remain overdue. The absence of fire does not establish that these conditions are acceptable. The leading indicators identify issues requiring attention before an incident occurs.
Equally, completing inspections on time should not end the review. Management should also examine whether defects were identified accurately, prioritized appropriately and resolved effectively.
Benefits of Leading and Lagging Indicators
Using leading and lagging indicators together helps organizations assess preventive efforts alongside actual safety outcomes.
- Balanced performance assessment: Leading indicators show how risks are being managed, while lagging indicators reveal injuries, illnesses and losses that have occurred.
- Better decision-making: Combined information helps management identify weaknesses, prioritize corrective actions and allocate resources.
- Support for prevention and learning: Leading indicators encourage early intervention, while lagging indicators provide lessons from past incidents.
- Clearer accountability: Defined measures help teams monitor responsibilities, deadlines and progress toward safety objectives.
- Continuous improvement: Reviewing both types over time helps assess whether preventive actions are contributing to better outcomes.
Limitations of Leading and Lagging Indicators
Both types require reliable data and careful interpretation to provide meaningful information.
- Dependence on data quality: Incomplete records, inconsistent definitions and underreporting can produce misleading results.
- Activity may not demonstrate effectiveness: Completing inspections or training does not automatically mean hazards are controlled or workers are competent.
- Delayed feedback: Injury and illness statistics become available after harm has occurred; some occupational illnesses take years to appear.
- Potential for false confidence: High activity completion rates and low injury numbers can coexist with serious uncontrolled risks.
- Risk of target manipulation: Pressure to achieve favourable results may encourage superficial action closure or discourage incident reporting.
- Limited comparability: Differences in working hours, exposure, operations and reporting methods can make comparisons unreliable.
- No guarantee of future safety: Indicators support judgement, but they cannot replace workplace inspections, worker consultation and verification of critical controls.
Leading and Lagging Indicators: How Safety Performance Is Measured
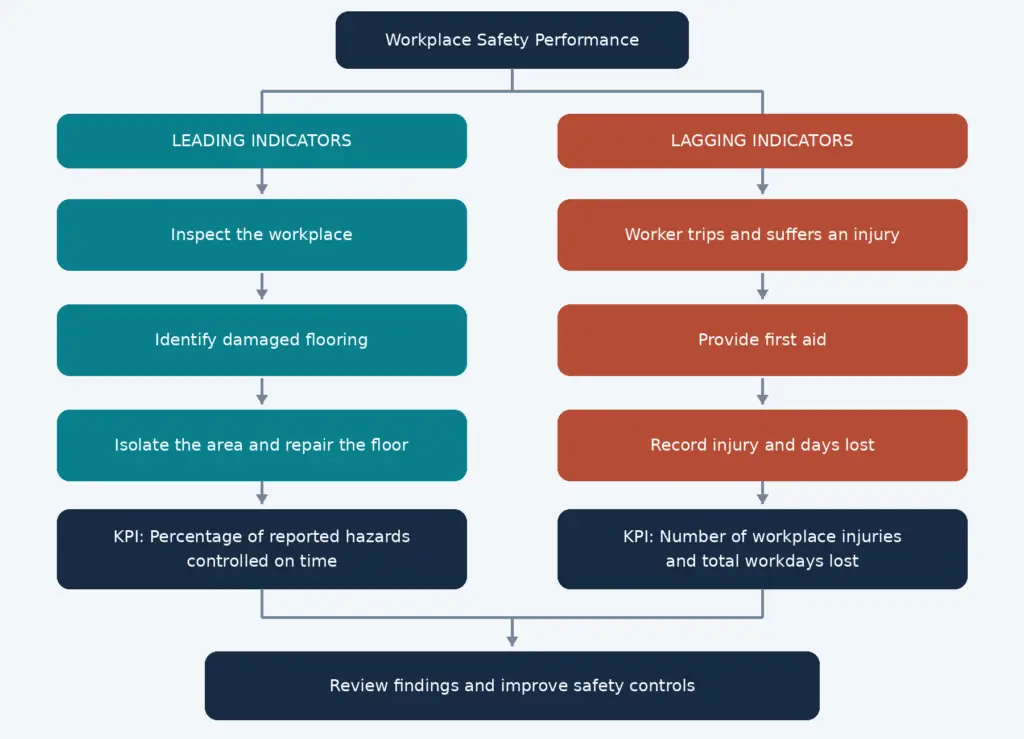
Organizations weaken their KPI systems when they track too many measures, focus only on injury rates, compare incompatible data or treat completed paperwork as proof of effective control.
Another common mistake is rewarding low reported incident numbers without considering reporting quality. Employees should feel able to report injuries, hazards and near misses honestly.
Finally, dashboards should support discussion and action. A green score provides little value if serious unresolved issues remain hidden within the underlying data.
Conclusion
Effective safety KPIs help organizations understand both the strength of their preventive arrangements and the outcomes those arrangements produce.
Leading indicators support timely intervention. Lagging indicators provide evidence of events, consequences and historical patterns. Used together, they create a stronger basis for evaluating performance and setting improvement priorities.
The purpose of measuring safety performance is to turn reliable information into decisions that protect people and improve how work is managed.