
Fishbone Model for RCA – Case Application on Rana Plaza Collapse
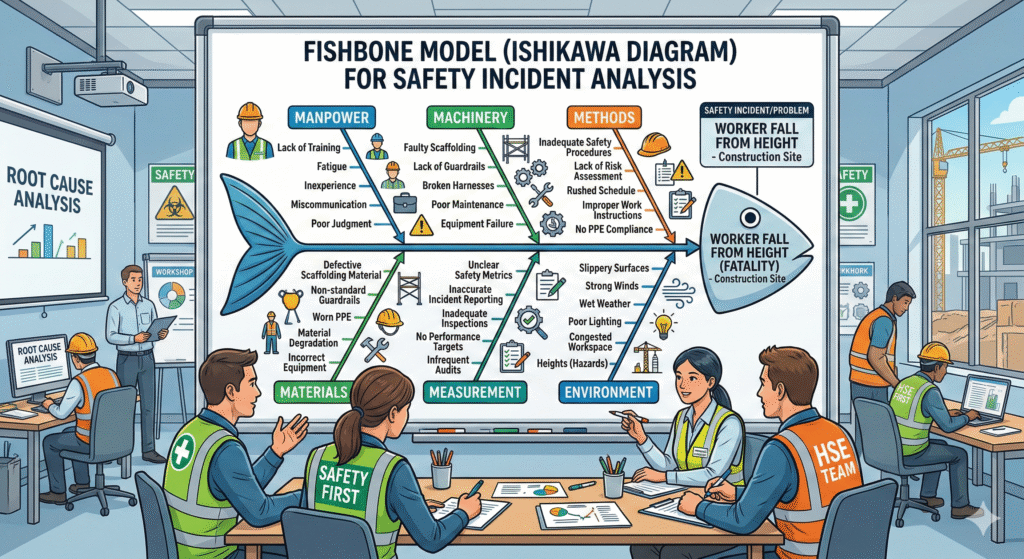
The Fishbone Diagram (also called Ishikawa Diagram or Cause-and-Effect Diagram) is a structured Root Cause Analysis (RCA) tool used to systematically identify, categorize, and analyze contributing factors of a failure event. In high-risk industries such as construction, manufacturing, and occupational safety, the Fishbone model prevents superficial conclusions and forces investigation into systemic weaknesses. The collapse […]