

(Ishikawa Diagram): A Complete Guide to Root Cause Analysis
Introduction
The Fishbone Diagram Analysis, also known as the Ishikawa Diagram or Cause-and-Effect Diagram, is one of the most powerful Root Cause Analysis (RCA) tools used in occupational health and safety, quality management, manufacturing, construction, engineering, healthcare, and business management. The technique was developed by Kaoru Ishikawa to help organizations systematically identify the causes of problems and develop effective solutions.
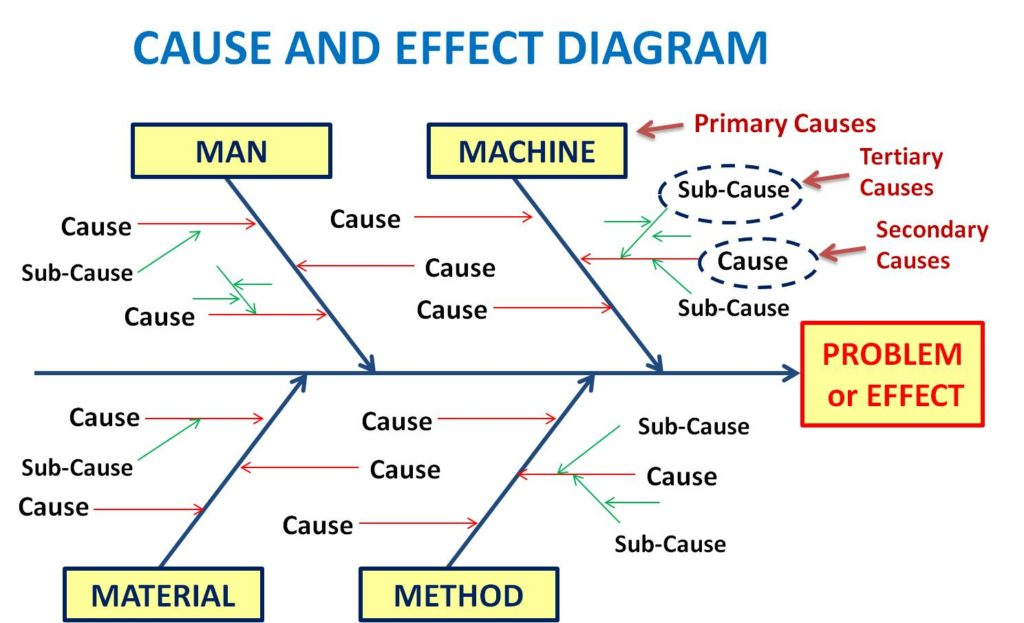
The Fishbone Diagram gets its name from its appearance. The structure resembles the skeleton of a fish, where the head represents the problem being analyzed and the bones branching from the spine represent various categories of potential causes. This visual approach helps teams organize information, identify contributing factors, and understand how different causes interact to create a particular problem.
In workplace safety, accidents and incidents rarely occur because of a single cause. Most incidents result from multiple factors involving people, equipment, procedures, environment, materials, and management systems. The Fishbone Diagram helps investigators examine all possible causes systematically rather than focusing only on obvious issues.
Organizations worldwide use Fishbone Analysis because it encourages teamwork, promotes critical thinking, improves problem-solving, and supports continuous improvement. Whether investigating workplace accidents, quality defects, equipment failures, customer complaints, or operational disruptions, the Fishbone Diagram provides a structured framework for identifying root causes and preventing recurrence.
What is a Fishbone Diagram?
A Fishbone Diagram is a visual Root Cause Analysis tool used to identify, organize, and analyze the possible causes of a specific problem. It helps teams explore all potential contributing factors rather than making assumptions about why an issue occurred.
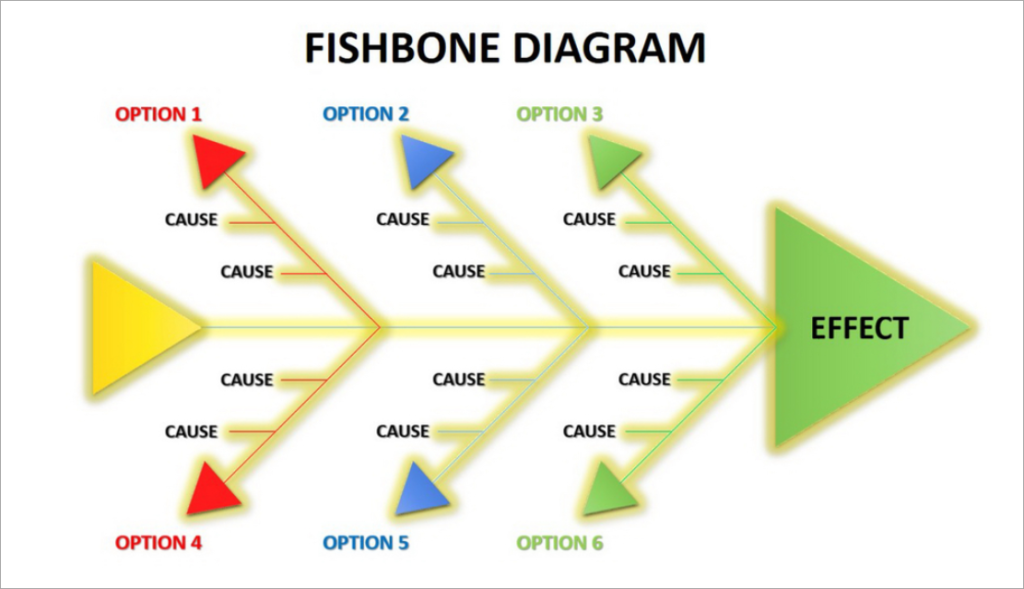
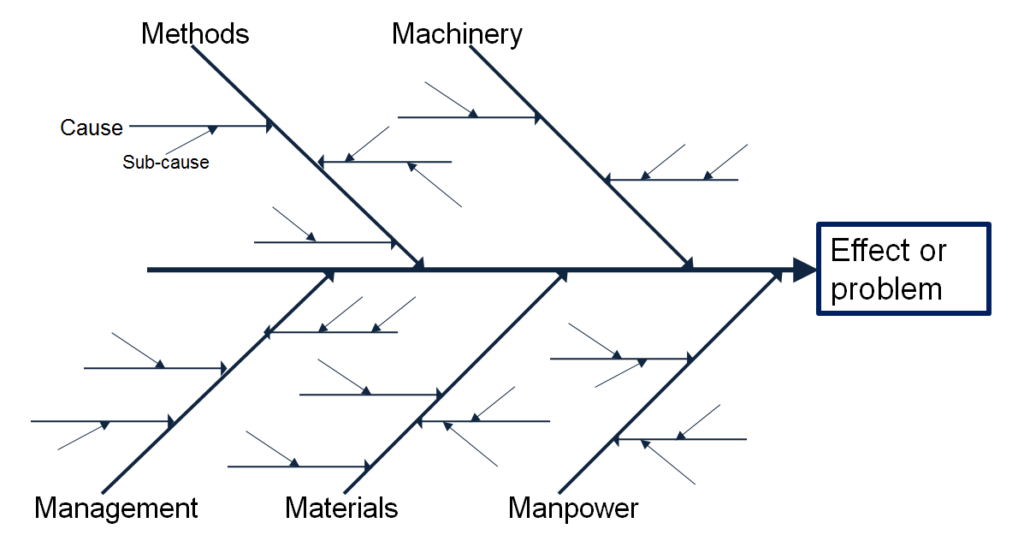
The problem being investigated is written at the head of the fish. Major cause categories are drawn as large bones extending from the central spine. Smaller branches represent specific contributing factors within each category.
This structured approach allows investigators to examine problems from multiple perspectives and identify relationships between different causes. By doing so, organizations can develop more effective corrective and preventive actions.
Unlike simple brainstorming, Fishbone Analysis follows a systematic process that ensures all possible causes are considered before conclusions are reached.
Purpose of Fishbone Diagram Analysis
The primary purpose of Fishbone Diagram Analysis is to identify the root causes of problems rather than merely addressing symptoms. Many organizations make the mistake of solving immediate issues without understanding why they occurred. As a result, the same problems continue to reappear.
Fishbone Analysis encourages deeper investigation by examining all factors that may have contributed to the problem. It helps organizations understand the relationships between different causes and identify weaknesses within systems, procedures, equipment, and management practices.
The technique also promotes teamwork and collaboration because it involves input from employees, supervisors, managers, and subject matter experts who may have different perspectives on the problem.
Ultimately, Fishbone Analysis helps organizations improve safety, quality, efficiency, reliability, and overall performance.
History and Development of the Fishbone Diagram
The Fishbone Diagram was developed during the 1960s by Kaoru Ishikawa as part of quality management initiatives in Japan. Ishikawa believed that organizations could achieve better results by involving employees in problem-solving and continuously improving processes.
The diagram became one of the seven basic quality tools widely used in quality control and process improvement programs. Over time, its application expanded beyond manufacturing into safety management, healthcare, engineering, environmental management, and business operations.
Today, the Fishbone Diagram remains one of the most widely recognized and effective tools for Root Cause Analysis.
Structure of the Fishbone Diagram
The Fishbone Diagram consists of several key components that work together to organize information systematically.
The head of the fish represents the problem or effect being investigated. This may be an accident, equipment failure, quality defect, customer complaint, environmental incident, or operational disruption.
The spine serves as the central line connecting the problem to the various cause categories.
The major bones represent broad categories of potential causes.
The smaller bones branching from the major categories represent specific contributing factors and underlying causes.
This structure provides a clear visual representation of how different factors contribute to the problem.
The 6M Categories of Fishbone Analysis
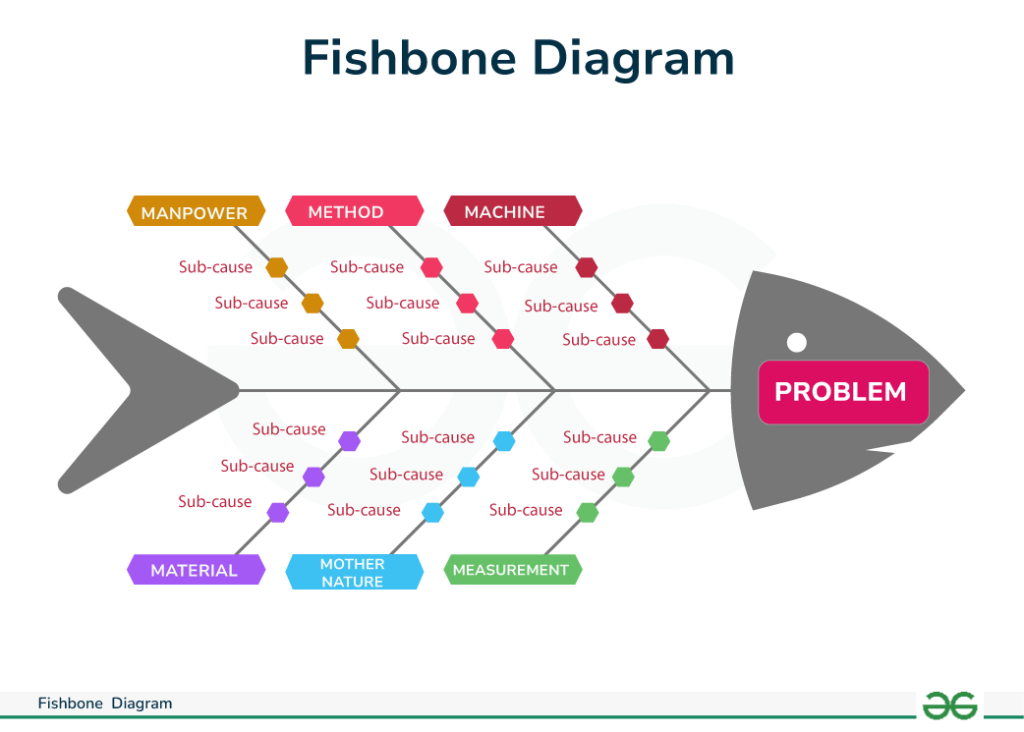
One of the most common approaches to Fishbone Analysis is the 6M model. These categories help investigators explore causes systematically.
Man (People)
The People category focuses on human factors that may contribute to the problem. These include lack of training, inadequate skills, fatigue, stress, poor communication, unsafe behaviors, human error, lack of supervision, and insufficient competence.
Many workplace incidents involve human actions; however, Fishbone Analysis encourages investigators to explore why those actions occurred rather than simply blaming individuals.
Machine (Equipment)
The Equipment category examines machinery, tools, technology, and physical assets involved in the process.
Potential causes include equipment failure, inadequate maintenance, design flaws, malfunctioning safety devices, worn components, calibration errors, and mechanical breakdowns.
Proper analysis helps identify weaknesses in equipment management systems.
Method (Procedures)
The Method category focuses on work procedures, operating instructions, policies, and processes.
Potential causes include unclear procedures, outdated instructions, lack of standardization, inadequate risk assessments, poor planning, and ineffective work methods.
Procedural weaknesses often contribute significantly to workplace incidents.
Material
The Material category examines raw materials, chemicals, components, and supplies used during operations.
Potential causes include defective materials, contamination, incorrect specifications, poor storage conditions, and incompatible substances.
Material-related issues can affect both safety and quality outcomes.
Measurement
The Measurement category focuses on monitoring systems, inspections, audits, testing processes, and performance indicators.
Potential causes include inaccurate measurements, insufficient inspections, poor data collection, calibration problems, and ineffective monitoring systems.
Reliable measurement systems are essential for maintaining operational control.
Mother Nature (Environment)
The Environment category examines workplace conditions and external influences.
Potential causes include temperature extremes, weather conditions, lighting deficiencies, noise levels, vibration, poor housekeeping, workspace layout, and environmental hazards.
Environmental factors can significantly influence human performance and operational safety.
How Fishbone Diagram Analysis Works
The analysis begins by clearly defining the problem. Once the issue is identified, investigators gather a team of individuals familiar with the process or incident.
The team then brainstorms possible causes within each category of the Fishbone Diagram. Every idea is recorded without immediate judgment or criticism.
After all potential causes are identified, the team evaluates each factor to determine its significance and relationship to the problem.
Investigators may use additional techniques such as the 5 Whys Method to explore specific branches of the diagram and identify deeper root causes.
The final stage involves prioritizing causes and developing corrective actions to eliminate or control them.
Example of Fishbone Diagram Analysis
Imagine a workplace accident involving a worker who suffered an injury while operating machinery.
The problem is placed at the head of the fish as “Worker Injury During Machine Operation.”
Under People, investigators identify inadequate training and operator fatigue.
Under Equipment, they identify faulty emergency stop buttons and poor maintenance.
Under Methods, they identify missing lockout-tagout procedures.
Under Materials, they identify defective machine components.
Under Measurement, they identify inadequate safety inspections.
Under Environment, they identify poor lighting and excessive noise.
By examining all categories, investigators gain a comprehensive understanding of the factors contributing to the incident.
Benefits of Fishbone Diagram Analysis
One major benefit of Fishbone Analysis is its ability to organize complex information visually. This makes it easier for teams to understand relationships between causes and identify patterns.
The technique encourages collaboration and knowledge sharing among team members from different departments and backgrounds.
Fishbone Analysis also promotes systematic thinking by ensuring that all potential causes are considered.
Another significant benefit is that it helps organizations focus on root causes rather than symptoms, leading to more effective corrective actions and long-term improvements.
Fishbone Diagram in Safety Management
In occupational health and safety, Fishbone Analysis is frequently used during accident investigations, near miss analysis, hazard assessments, and risk management activities.
Safety professionals use the technique to identify underlying causes of injuries, property damage, environmental incidents, and operational failures.
By addressing root causes, organizations can reduce incident rates, improve safety culture, and strengthen safety management systems.
The method is particularly valuable because it encourages investigation beyond human error and examines organizational and systemic factors.
Fishbone Diagram and Continuous Improvement
Continuous improvement requires organizations to learn from problems and implement meaningful changes. Fishbone Analysis supports this process by identifying weaknesses and opportunities for improvement.
The technique helps organizations strengthen processes, improve communication, enhance training programs, and optimize operational controls.
Regular use of Fishbone Analysis contributes to a proactive culture where employees actively participate in identifying and solving workplace problems.
Limitations of Fishbone Diagram Analysis
Although highly effective, Fishbone Analysis has certain limitations.
The quality of results depends on the knowledge and experience of the team conducting the analysis.
Brainstorming sessions may generate large numbers of potential causes, making prioritization challenging.
The technique identifies possible causes but does not automatically determine which causes are most significant. Additional investigation and evidence collection may be necessary.
For highly complex systems, Fishbone Analysis may need to be combined with other Root Cause Analysis methods such as Fault Tree Analysis, Barrier Analysis, or the 5 Whys Technique.
Conclusion
Fishbone Diagram Analysis is one of the most valuable Root Cause Analysis tools available for identifying and understanding workplace problems. By systematically examining potential causes across categories such as people, equipment, methods, materials, measurement, and environment, organizations can uncover hidden weaknesses and develop effective corrective actions. The technique supports accident prevention, continuous improvement, stronger safety management systems, and enhanced operational performance. When used correctly, Fishbone Analysis helps organizations move beyond symptoms and address the true causes of problems, creating safer workplaces and more reliable operations.